
Funda might have a goldmine of data available, but the real trick is to unleash its full potential. Esther Schrijer, Data Analyst at funda, shares how we completely transformed our reporting infrastructure and what that brings us. Spoiler: a lot of extra time!
After working for funda's online marketing team for 4 years, I joined the data team at the beginning of 2021. In my previous role, I worked with data by measuring campaigns, creating dashboards, and sometimes doing ad hoc analyses of specific customer-related topics. Funda is a company with tons of data, which is impressive but can also be a bit overwhelming because there is just so much out there. Back then I could have really used some clear overviews of exactly what data we had, where I could find it and if anyone else had already done some analyses of certain topics.
Once I became part the data team, I learned that this had something to do with the complex data infrastructure we had. When I joined, improving the data infrastructure was exactly what the team were already working on and planning to work on for the year to come.
First things first: what is data infrastructure?
Data infrastructure is a full set-up to store, maintain, organise and distribute data, in order to provide insightful information.
The general and simplified set-up for data infrastructure looks something like this:
1. Source system: Collects data, for example user data from behaviour on the website
2. Data warehouse: Stores raw and transformed data from various sources
3. Reporting: Make data insightful by visualising it in graphs and tables
Data infrastructure can get complicated when there are multiple data sources, warehouses, and reporting tools to get data from and send data to. In many cases, companies adopt new tools and processes over the years, but do not stop using all the already existing ones. This can generate legacy data flows that still need to be maintained, which costs a lot of time and money.
Funda’s old data infrastructure
The overview below provides a simplified view of funda's old data infrastructure. As you can see, data came in from various sources, was sent to two different data warehouses and was then presented in three distinct types of reporting tools. Our data consumers would sometimes just use the reporting tools, but also retrieve data directly from the different data warehouses. Data consumers at funda can be anyone, from light to heavy data users. For example: data scientists and data engineers make sure the data is loaded and transformed correctly so that the business developers can create reports and analyse the data. The management team or other leads look at these reports to base their conclusions on.
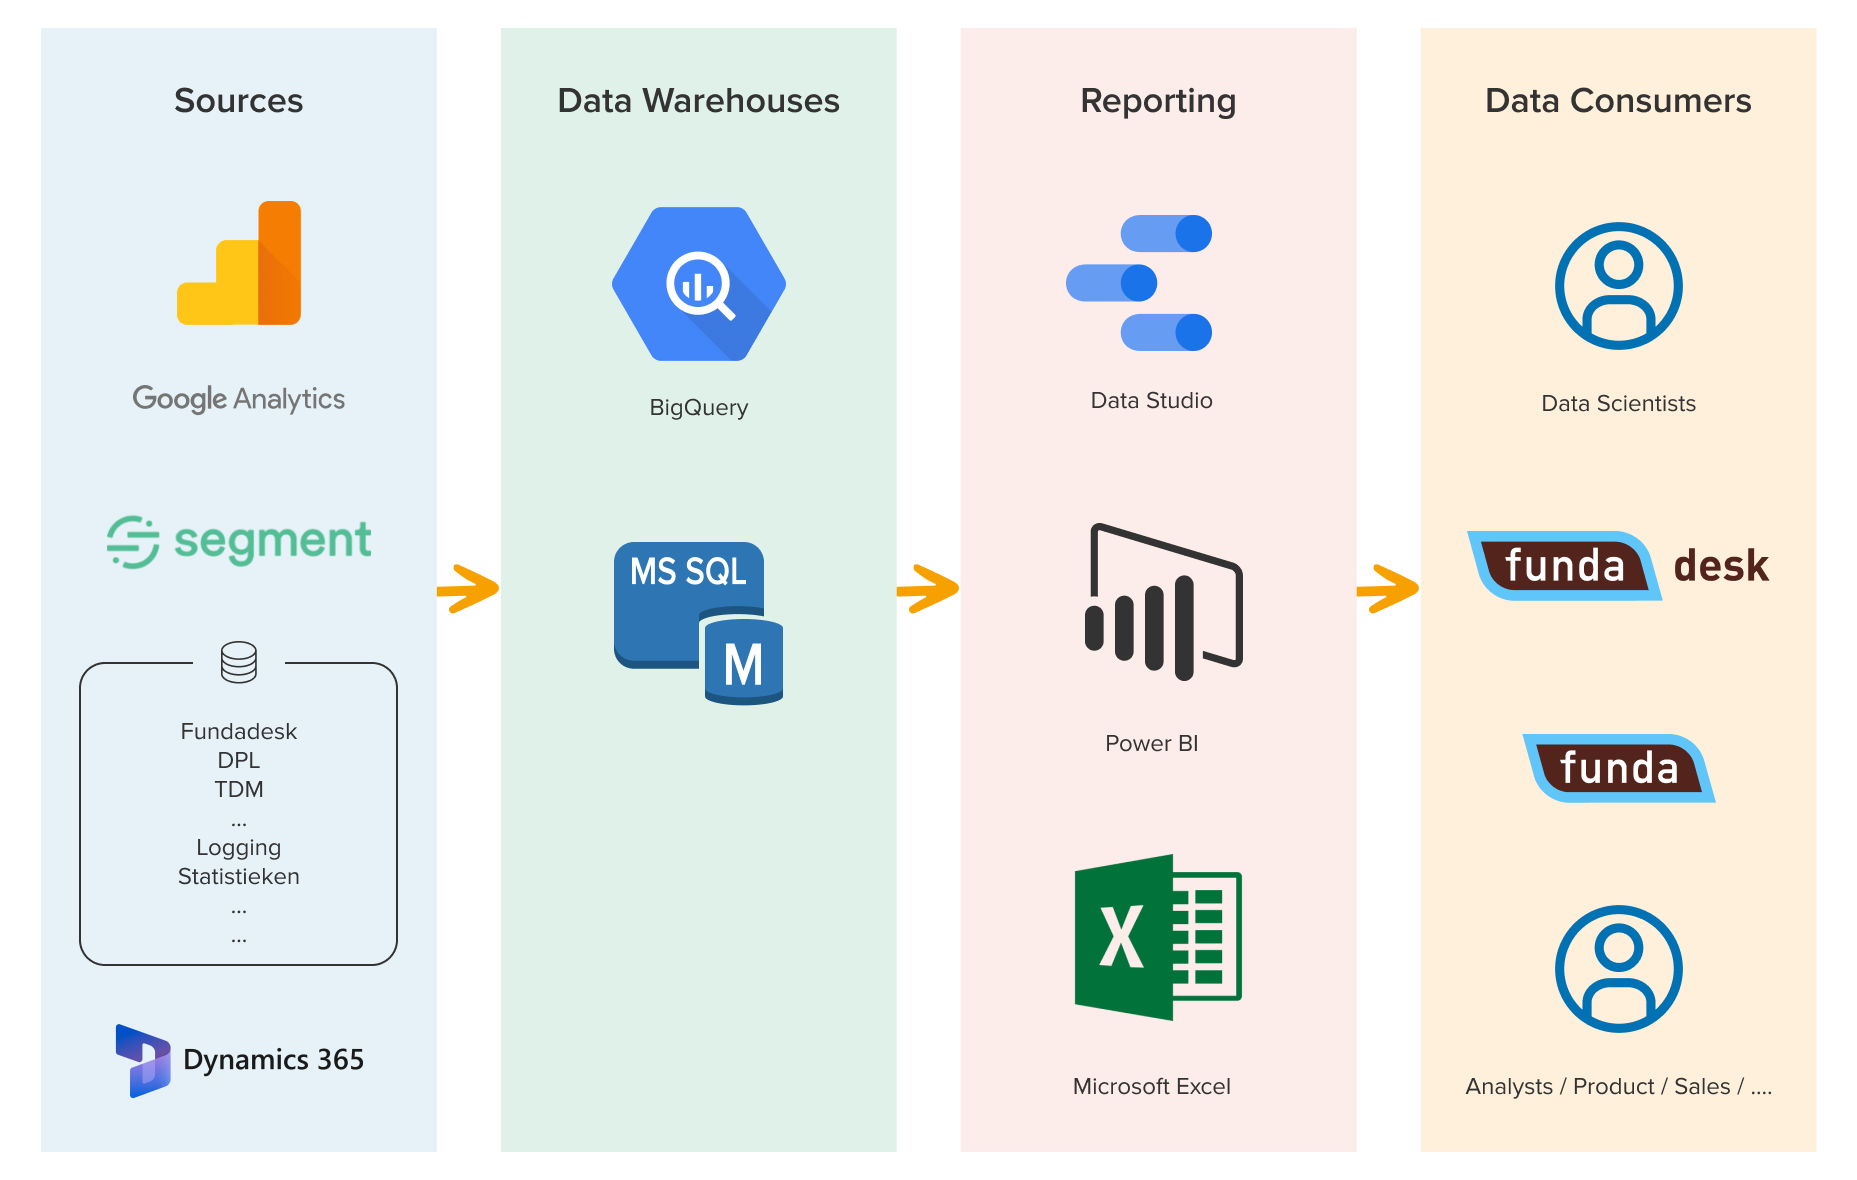
Some problems we faced with this set-up:
· Data consumers within funda would see various sources of truth for the same metric or insight, such as a small difference between tracking on the website for Google Analytics and Segment for the same event. It is normal that different sources differ slightly from each other, but it can cause confusion.
· It was harder to troubleshoot or replicate a question from data consumers to find out exactly what they did and what data they used.
· Data consumers did not have access to the data they needed in dashboards or did not know where to find it. This resulted in various dashboards with redundant data being created by different data consumers. One team would use specific dashboards for interactions on the website, while another team had their own dashboards to look at these interactions.
· Testing and checking all distributed data within the organisation was difficult for the data team since all data consumers created and shared their own insights without having a centralised location where all this was shared and stored.
Having this old structure was a result of the set-up we had at the time. Before 2021, every team handled their own dashboards, resulting in a wide variety of around 85 dashboards, spread out across different tools, and with some dashboards not being accessible for a part of the organisation. These dashboards were often created when the user was not aware that there was already another dashboard with the same metrics, or when an already existing dashboard did not have enough filter options for the user to get the exact data they needed. For this reason, some dashboards only contained two graphs.
Additionally, at the time we did not have a fully staffed and dedicated data team. With constant new developments, it made sense that we got newer and better tools, but there was never enough time to fully migrate to the new tools and phase out the old ones.
For a company that has ‘data drives our decisions’ as a core driver, or fundamental as we like to call it, it was time to improve this process.
How we restructured our data warehouse
Starting with improving the data infrastructure, the data team focused on going from multiple data warehouses to one. During this project, funda hired a new data analyst and two new data engineers. That really helped to speed up the process, and meant we were fully staffed moving forward.
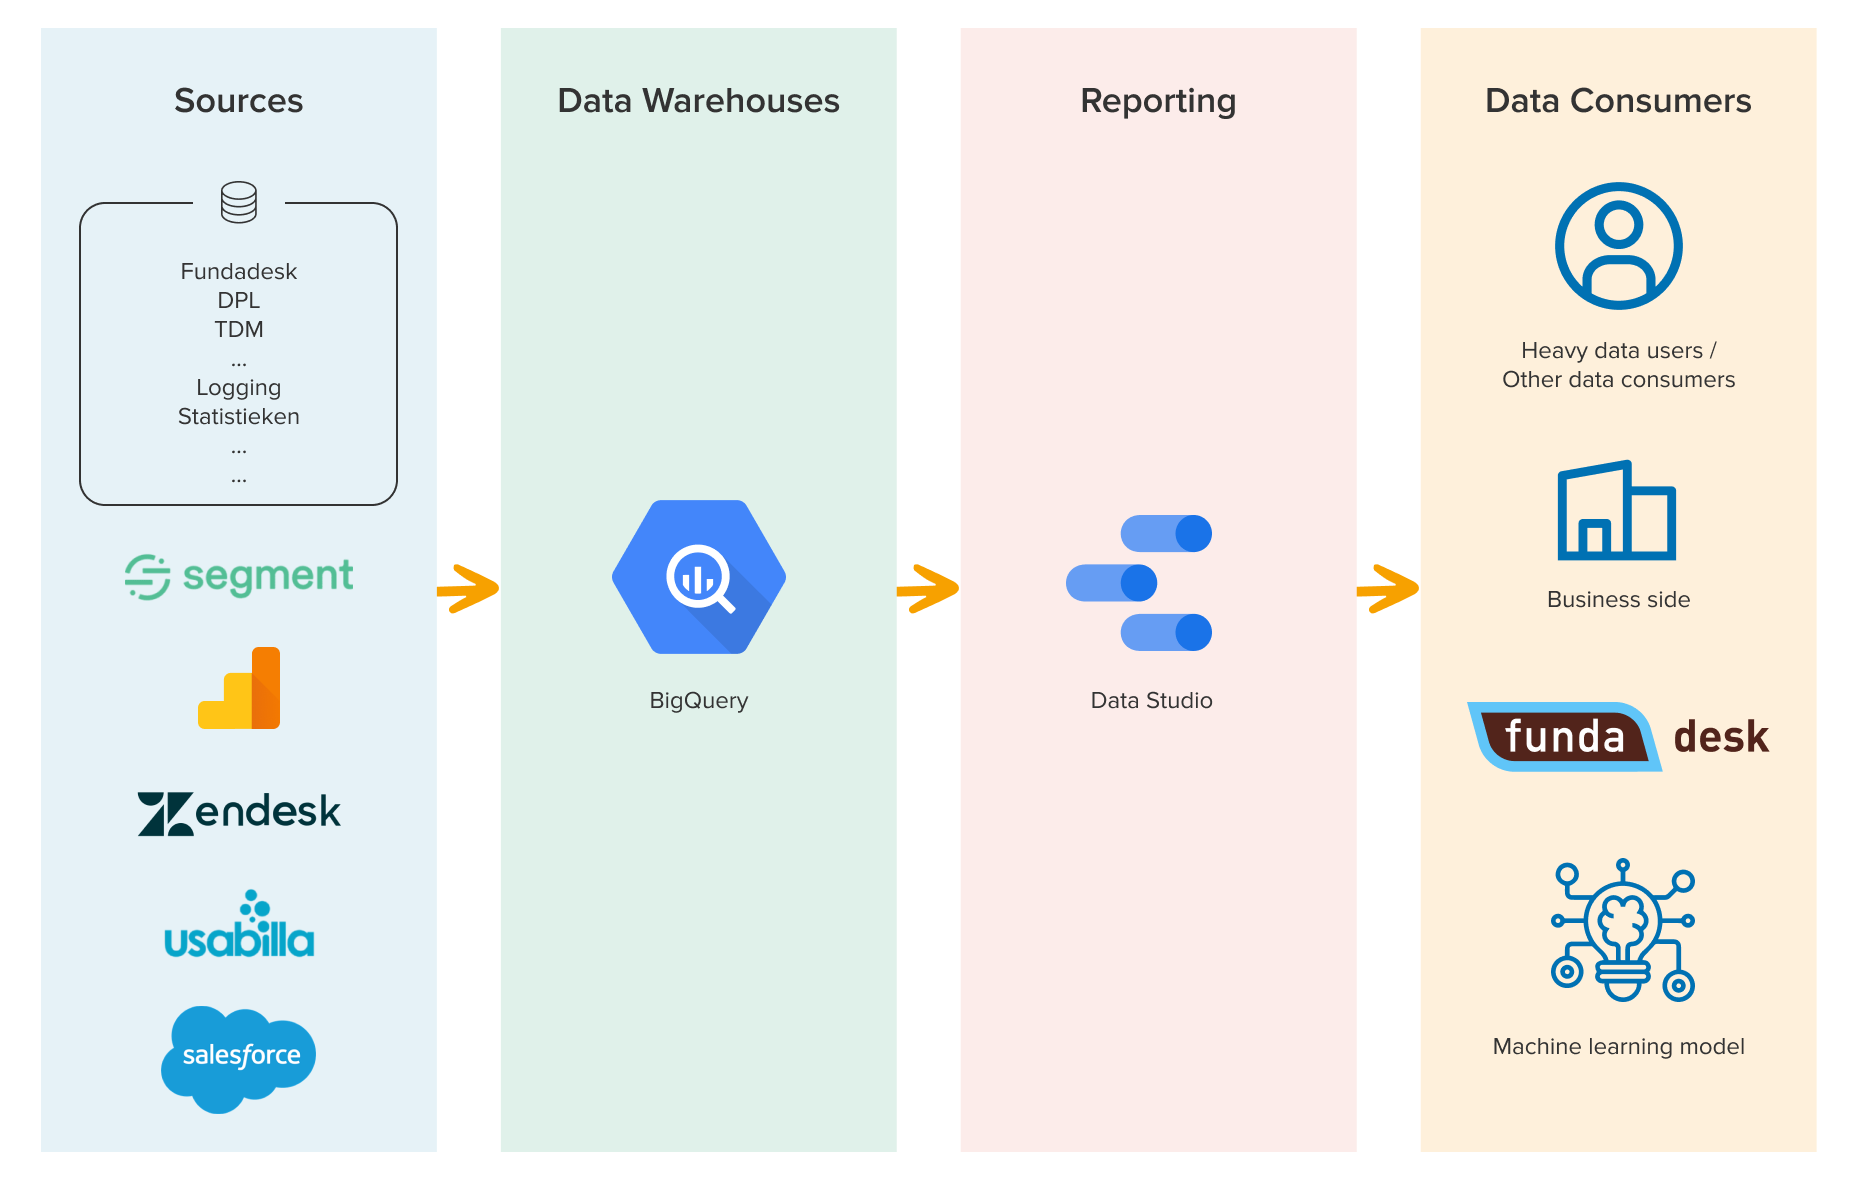
Google BigQuery was chosen as the data warehouse for funda's data infrastructure, and it became the single source of truth for the reporting tools and data consumers. We selected BigQuery because it is a modern, fully managed cloud data warehouse with extensive built-in features. For example, you can execute queries using StandardSQL in an effortless way. What's more, other tools and platforms offer good integration with BigQuery.
We use Google BigQuery together with dbt, which is short for data build tool. Dbt enables both data analysts and engineers to transform data in a data warehouse by writing SQL statements. Dbt then returns the data in an easy-to-analyse form like tables and views. Using dbt has really helped us work in a more structured way, thanks to all the features it offers. Data is loaded into dbt, can be transformed there and then published in BigQuery. It has also brought the data engineers and analysts closer together by enabling the latter to create incrementally updated datasets, freeing up time for engineers to pick up other tasks.
Since we are now using one data warehouse there is only one source of truth, which has drastically decreased the number of questions about incorrect data or confusion with calculating a metric.
How we restructured our reports
After looking at the data warehouse it was time to consider the way reporting is done at funda. Last year, a large part of our time was spent migrating all the legacy dashboards to one new dashboard tool for everyone within the company. This was an extensive list of around 85 dashboards that were spread out over various reporting tools: some were no longer used, resulting in broken graphs; some were not supposed to be in use any more, because of incorrect or outdated data; and others were important, but not known to everyone within funda.
After investigating our reporting needs and demos from reporting tools we decided to go for Google Data Studio as our main reporting tool. Some of the reasons for this choice were: the dashboard functionalities it provides, its simplicity, the options to allow us to do a company-wide roll out, and the fact that it integrates well with our data warehouse of choice, BigQuery.
The migration was a sizable project that involved moving from 85 dashboards with redundant data to 5 core company dashboards widely used across the organisation and a couple of product/feature dashboards. Whenever teams create a product or feature dashboard, they can now add this to a centralised location which all funda employees can access.
Results and advantages
The new data infrastructure set-up saves us so much time and effort.
For data consumers within funda it is less complicated to get the right insights and results, with just one source of truth. They know where to build their dashboard and what source to use, and they also know where to find the dashboards that are already available. Others within funda that would like to see the data but are not creating dashboards themselves now know where to find it.
Funda's data analysts (including me!) can now deliver data insights to the organisation quickly because we can transform the data ourselves. Our data engineers do not have to spend time on supporting old data warehouses, and devote less time to[RT1] fixing old code and integrations. And we already have good reporting in place, so data consumers do not need to reach out to the data team as often as before, which also saves us time.
So, I am extremely happy with the team and the work that has been done, and I think we have built a solid data infrastructure. It's been a big project, but incredibly rewarding!