As you can imagine, funda's data pipeline is a massive challenge due to the large amounts of data. Esther Schrijer, Data Analytics Engineer, sheds light on how her team maintains an efficient and effective data structure. Read on to learn more.
As a Data Analytics Engineer with 6 years of experience at funda, I've seen our Data Team, our tools and our processes change over time. Two years ago, we still used several tools, which sometimes made it unstructured. We also didn’t have as many processes in place around how to deal with our large amounts of data.
But nowadays our data is well organized. In this blog post, I will share some of the strategies and tools we now use to manage our data pipeline and ensure that our data is clean, consistent and ready to be used for analysis and reporting.
Extracting and transforming data from sources to warehouse
At funda, we use a number of tools and platforms to collect data from different sources, including Segment, Salesforce, our own funda databases, and Usabilla. These sources are referred to as data sources, and they generate several types of data, such as user behaviour data, sales data, financial data, and feedback data.
To store and analyze this data effectively, we use a data warehouse. Funda's data warehouse is hosted on Google's BigQuery platform, which provides a powerful and flexible solution for storing and querying large amounts of data.
The process of moving data from a data source to a data warehouse involves several steps, typically referred to as ETL: extract, transform, and load. This means extracting data from the source systems, transforming it to meet our business needs, and loading it into the data warehouse.
Data build tool
At funda, we use dbt, data build tool, to manage the ETL process. With dbt, we can automate the extraction, transformation, and loading of data into BigQuery. This allows us to keep a clear overview of our data, generate insights, and make data-driven decisions. Dbt also provides powerful tools for testing and documentation, which helps us ensure the quality and reliability of our data.
Dbt has definitely improved the way we work in our data team at funda. It helps us to work more efficiently and effectively with our data to generate insights and make data-driven decisions. We've also noticed that it makes it easier for our data analysts to support the transformation process, meaning they don't always have to wait for data engineers to create usable data for them when they have a data request.
As a result, we have become more agile and responsive to the needs of the business and have improved our collaboration with other teams within funda. For us, dbt has been really helpful and brought us only advantages; using this tool to manage our ETL processes has been really great.
Understanding funda's data layers
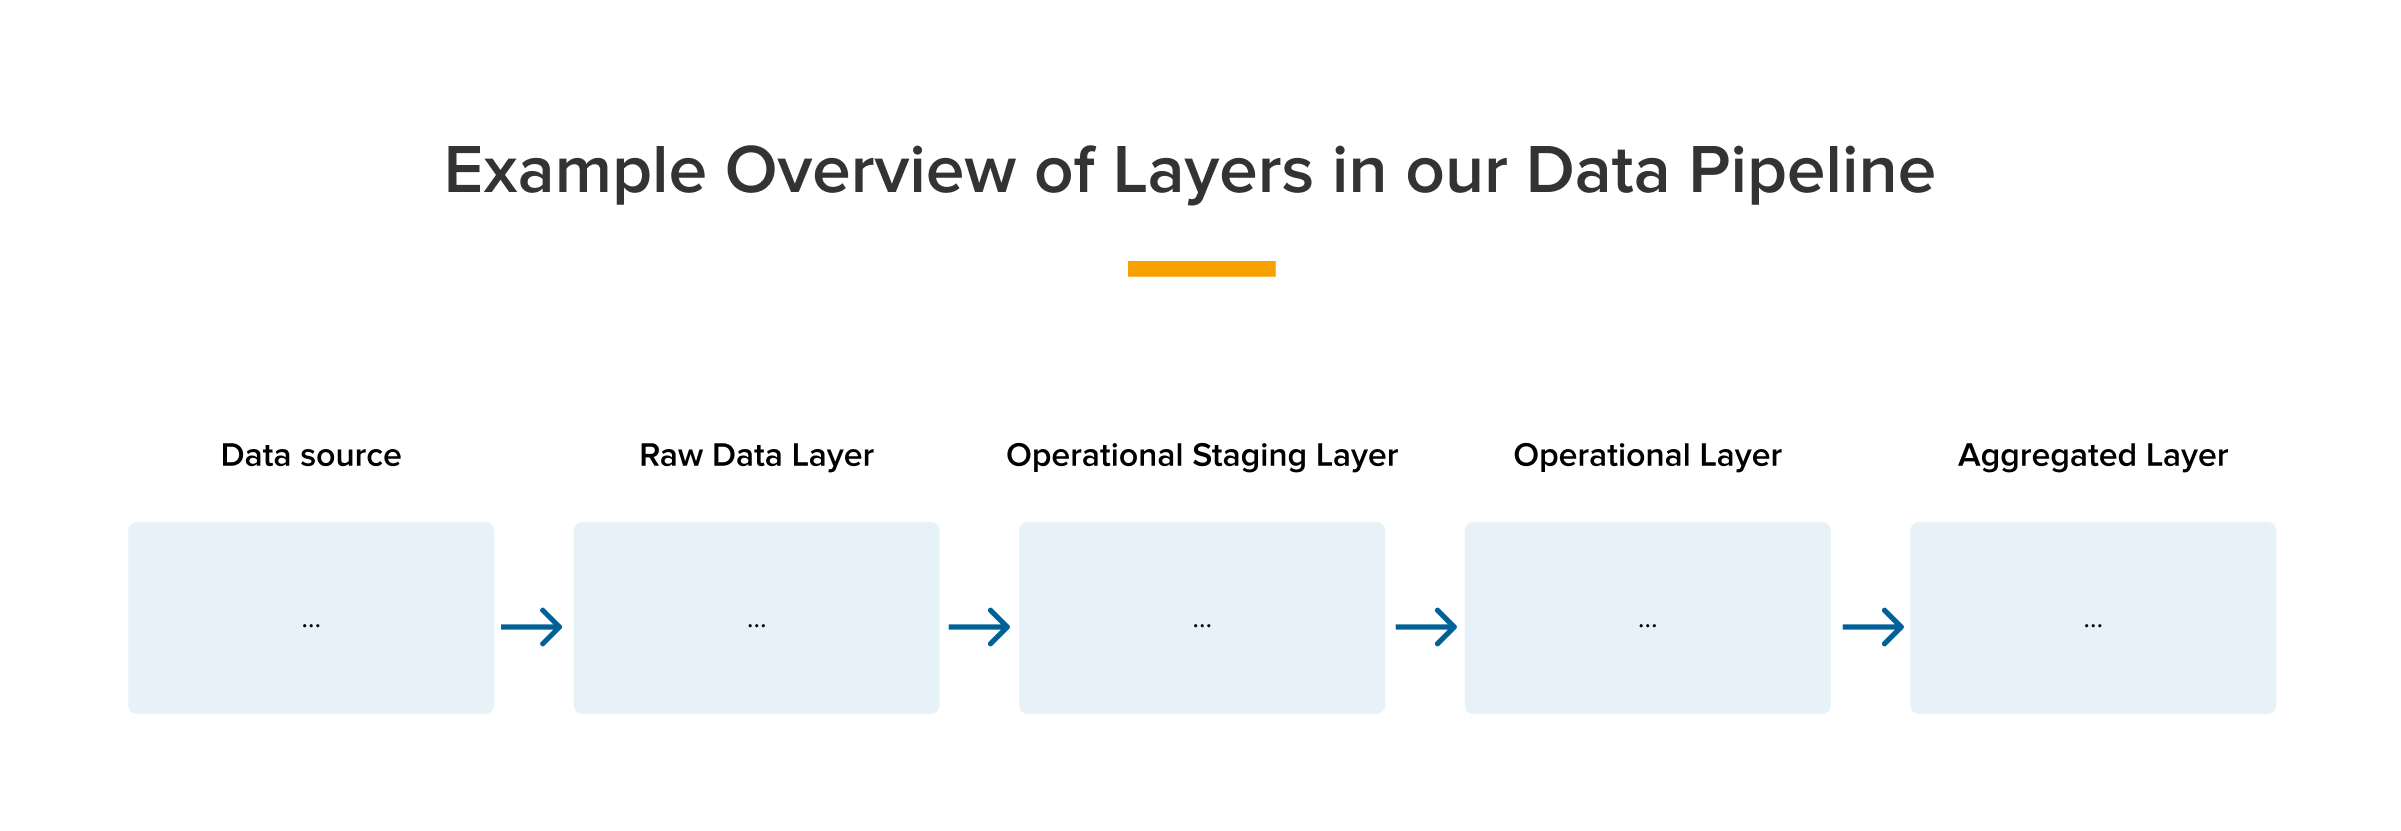
It is now time to explain how the data pipeline is structured. At funda, we have organized our data pipeline in dbt into different layers. The visualisation below displays the different layers: the data sources, and the four layers of data transformation, namely the Raw Data Layer (RDL), Operational Staging Layer, Operational Data Layer (ODL), and Aggregated Data Layer (ADL).
Once we have extracted our source data into dbt, we begin the transformation process by creating our first layer, the Raw Data Layer (RDL). At this stage, we focus on cleaning up the data by removing major issues like duplicates, while trying to keep the RDL as close as possible to the original raw data coming in from the data sources.
See also: Game changer: How we went from 85 to 5 core data dashboards
Raw Data Layer
The RDL is critical because it determines the foundation for the rest of the data warehouse layers. By ensuring that the data in the RDL is clean and well-structured, we can avoid downstream problems and ensure the accuracy of our data analysis. Once we have cleaned up the data in the RDL, we move on to the next layer, the Operational Staging Layer (ODL Staging), where we ensure that the data is used consistently across all underlying models.
Operational Staging Layer
In the staging layer, we do some basic transformations that are important for the models that will be based on these staging models. These transformations can include things like renaming columns, categorizing data, changing data types, or computing metrics, like converting dollars to euros. It's important to note that we don't do any aggregations or anything similar in this layer.
The goal of the staging layer is to make sure that the data is clean, consistent and structured in a way that makes it easy to work with. This means that when we move on to the operational layer, we can be sure that the data is of high quality and ready to be used for analysis and reporting. Additionally, the staging layer helps to ensure that the data is used in the same way in the underlying models. We often add some business rules that we want to include in all our funda models in this layer.
Operational Data Layer
The Operational Data Layer (ODL) is the intermediate layer in our dbt project. In this layer, we start doing some generic calculations that are important for many of our funda models. This can include things like calculating revenue, and summarizing users, brokers, and object information. The ODL is where we start to summarize data, and where we begin to add some business logic to our models.
At this stage, we are still working with relatively raw data, but have made some initial transformations and have started to apply some basic calculations. The ODL is where we begin to build up the complexity of our models, and where we start to add some of the specific business rules and requirements that are unique to our company. This layer helps us to ensure that the data is structured in a way that is optimized for analysis and reporting, and that is consistent across all of our models.
It's important to note that the models in this layer are mostly not ready to be used by end users, and are not always accessible to anyone. Instead, the ODL layer serves as an intermediate step in the data pipeline, helping us to prepare the data for further analysis and processing in the next layer. Specific aggregations and counts are done in the Aggregated Data Layer (ADL).
Aggregated Data Layer
In the ADL, we create specific models for business cases or dashboards with aggregated numbers and counts. This layer is where we apply more advanced calculations, aggregations and data manipulations to create the specific views and summaries that our end users will need.
The models in this layer are designed to be easily accessible and user-friendly, with clear names that reflect their purpose. We use these models in our reports and dashboards, which allow our end users to quickly and easily access the data they need to make informed decisions.
Because the ADL is built on top of the ODL, we can be sure that the data is consistent and accurate, and that any business logic or rules have been applied correctly. This layer allows us to create specific views of the data that is optimized for reporting and analysis, without having to worry about the underlying complexity of the data models.
Example data pipeline
In the example below, we see the data pipeline for a model that shows per broker if they have a specific contract. This ADL model comes from a sales request that can be used to contact brokers that don’t have a contract yet or paused one.
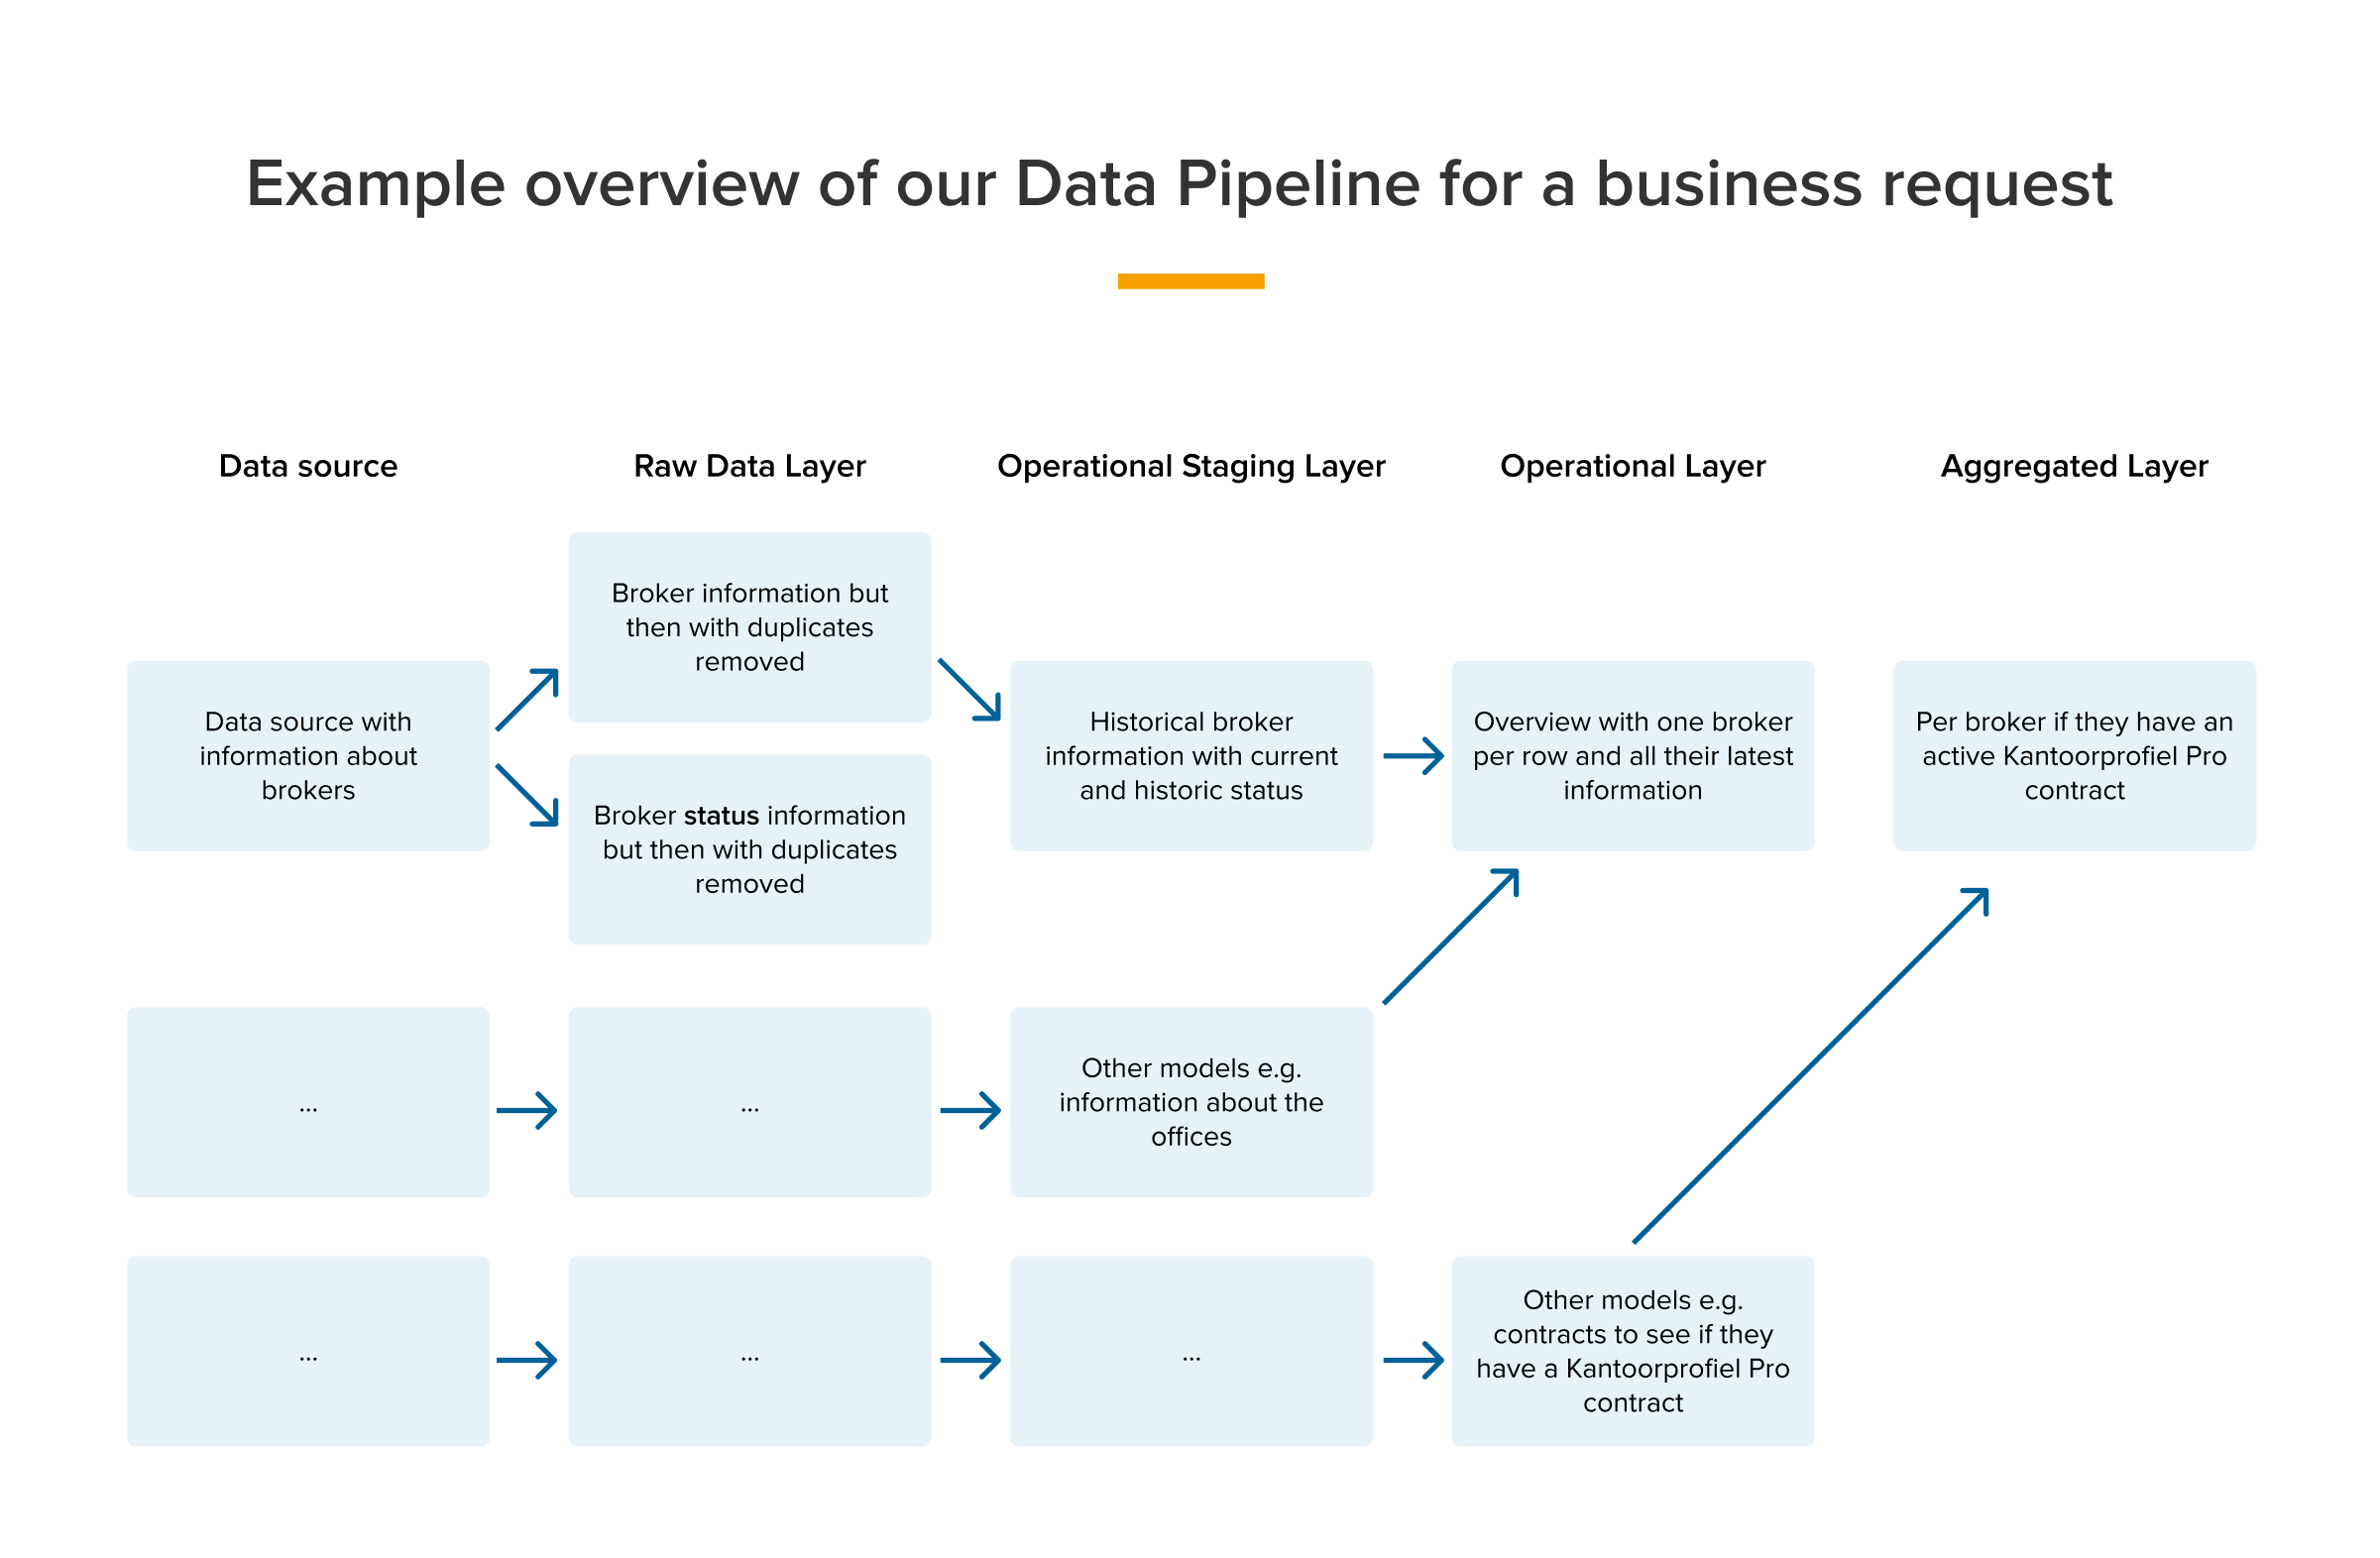
Managing a data pipeline with multiple data sources and models can be a challenging task, as it requires keeping everything organized and structured in a way that makes it easy to work with. With so many different parts, it's important to have a clear understanding of the data flow and to have processes in place to ensure that the whole ETL works well, and that the right data ends up in the right models. Without an organized data pipeline, it can be difficult to keep track of data changes, maintain data quality, and ensure that everyone is working with the same information.
We are very happy with our data pipeline and the way it’s set up in dbt. As you can see in the example above, we start with some general data, and work our way towards the downstream models in the pipeline where the data gets more detailed and specific for a business case. With this structure, we can create multiple models based on the upstream models, which will all use the same data.
What’s next?
Now that we have a good structure for our data pipeline at funda, we can focus on improving the quality of each layer. This means adding more detailed descriptions and tests for each model and column so that we can quickly identify and fix any errors in our data.
By doing this, we can ensure that our data is accurate and consistent across all our models, which will ultimately lead to better insights and more informed decision-making. Our plan is to concentrate on this during the second half of 2023. And who knows, I might write another blog post on this process as well!
See also: Game changer: Why we implemented an Advertising UI Library (and how)